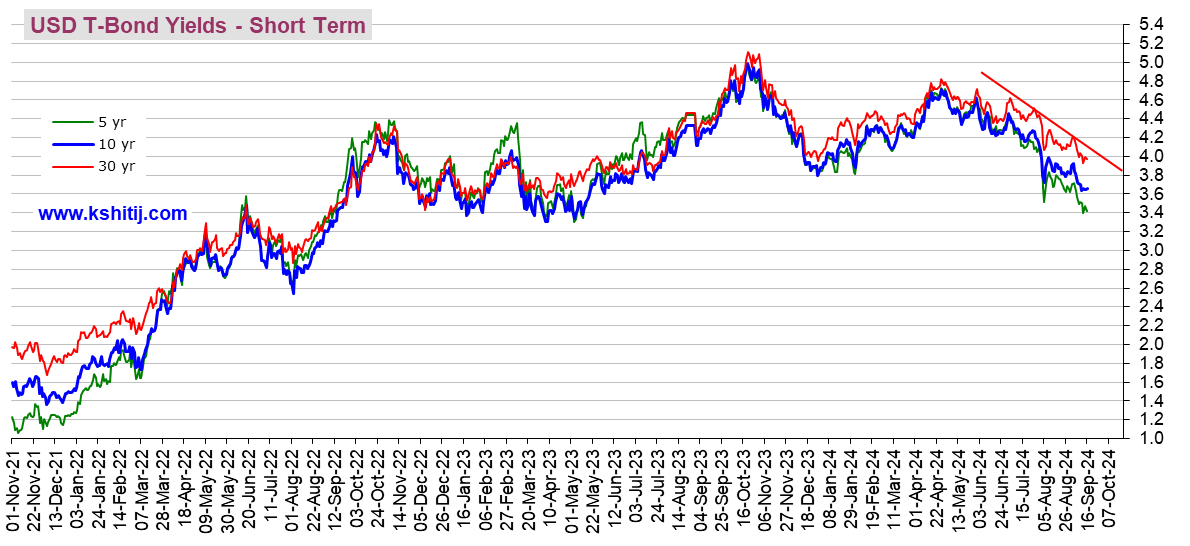
I had hoped to find a 6 month graph like the graphs in the OP, but oh well. This is a 2 2/3 year one.
The peak point on the 10 year Treasury bond (dark blue), which is my focus, is October 2023 at very near 5.0%
Then there is good news on inflation in the last quarter of 2023 and yields go down -- it goes down to about 3.8%, then rises (on bad news about inflation in the first quarter of 2024) up to a 2nd peak of about 4.7% in late April. The good May and June inflation reports that came out mid-June and mid-July respectively caused it to go back down to around 4.2% where it is now. (Admittedly, I don't see any good inflation reports that were available in late April or May that would have started yields downward).
When the yield goes down, my intermediate term bond funds go up in value. And the opposite when yields go up.
One that I monitor went up 13% in value from October 2023 to late December (but still at an overall loss). Just goes to show how bonds can swing quite widely in value in a short time. And then back down again.
Picking one, VCOBX, it's down 7.3% since November 2021 (the beginning of the graph). That's total return, including reinvested dividends.
https://www.morningstar.com/funds/xnas/vcobx/chart
That's in nominal ordinary dollars. Meanwhile prices have gone up 12.3% since November 2021, according to the CPI
https://data.bls.gov/timeseries/CUSR0000SA0
So its inflation adjusted return is about -17.4%. Meaning for every basket of goods it could buy in November 2021, it can buy only 0.826 baskets of goods now.
We old people are told to have at least 40% in fixed income because such are supposedly steady investments. Sigh.
https://kshitij.com/graph-gallery/bond/usd-yields-Short-Term
The other reason to watch yields is that mortgage rates and auto loan rates tend to follow.
And to see how much credence and weighting the market is putting to the various inflation reports and how much more or less likely the Fed is to cut interest rates in the not-too-distant future.
