Welcome to DU!
The truly grassroots left-of-center political community where regular people, not algorithms, drive the discussions and set the standards.
Join the community:
Create a free account
Support DU (and get rid of ads!):
Become a Star Member
Latest Breaking News
Editorials & Other Articles
General Discussion
The DU Lounge
All Forums
Issue Forums
Culture Forums
Alliance Forums
Region Forums
Support Forums
Help & Search
2016 Postmortem
Showing Original Post only (View all)Chances of Wisconsin Presidential Vote Results shown to be 1 in 850, and Worse for Other States [View all]
Chances of Wisconsin Presidential Vote Results shown to be 1 in 850, and Worse for Other States
November 28, 2016
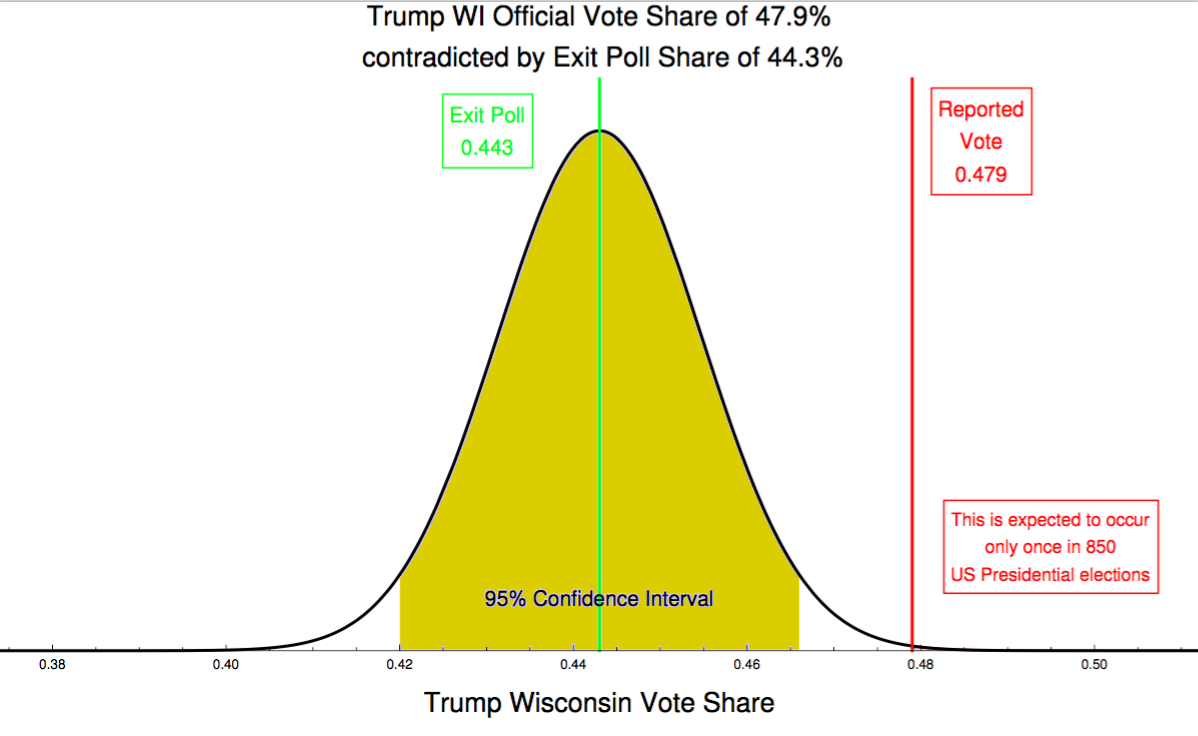
The Columbia Free Press has published images showing the statistical likelihood of variance from the exit poll results that the reported vote counts represent. In the case of Wisconsin (Figure 1), Trump received 44.3% of the exit poll share, but won the state with 47.9%. The likelihood of such departure is 1 in 850, which is much less than 1% chance of happening, actually at 0.1% chance.

Pennsylvania is another state slate for a recount request ............
November 28, 2016
The Columbia Free Press has published images showing the statistical likelihood of variance from the exit poll results that the reported vote counts represent. In the case of Wisconsin (Figure 1), Trump received 44.3% of the exit poll share, but won the state with 47.9%. The likelihood of such departure is 1 in 850, which is much less than 1% chance of happening, actually at 0.1% chance.

Pennsylvania is another state slate for a recount request ............
31 replies
 = new reply since forum marked as read
Highlight:
NoneDon't highlight anything
5 newestHighlight 5 most recent replies
Chances of Wisconsin Presidential Vote Results shown to be 1 in 850, and Worse for Other States [View all]
Coyotl
Dec 2016
OP
Those are exit polls adjusted to match reported results (except votes counted after the election)
Land Shark
Dec 2016
#3
Thanks - here is some onfo from Edison research who apparently does the actuall polling.
jmg257
Dec 2016
#12
Where are the raw ones? That question has been hovering in the air since at least 2000.
tandem5
Dec 2016
#9
the exit polls you are looking at have been "corrected" to correlate with the "results"
imaginary girl
Dec 2016
#5
A gap between exit polls and Election results beyond margin of error means one of them is wrong
Land Shark
Dec 2016
#10
The kicker is that since 2000 the exits are always red-shifted (election results better for Rs)
Land Shark
Dec 2016
#11
That is just crazy - what's the point then? They just want to get an idea of trends? Not
jmg257
Dec 2016
#14
Source: CNN.com. Compiled by Jonathan D. Simon election night, unadjusted numbers.
Coyotl
Dec 2016
#22
People protect themselves from disappointment. Nobody knows what the ballots really say
Land Shark
Dec 2016
#7
The Cuyahoga Election Board chairman was the head of the Ohio Republican Party in 2004.
Coyotl
Dec 2016
#20
Indeed. Each exit poll is a separate poll. What are the odds they all will shift red?
Coyotl
Dec 2016
#26